Firebug: The JavaScript Debugger
JavaScript is a core language of many web developers and a necessary component for any modern web application; therefore having an excellent JavaScript debugger and knowing how to use it effectively is key to fixing bugs faster. Fixing bugs faster also makes you a happier software developer!
I recommend Firebug, which is a JavaScript debugger, a real-time HTML, CSS, DOM, and JavaScript editor, and a network monitor.
Logging
One of the most useful features are the logging functions through console.log which can simply be used to output a string or object:
console.log('Testing log output: ', myObject);
This will output your message and the full object available for inspection in the Firebug console tab. In addition to console.log, there is also console.warn, console.error, and more. See the Firebug documentation for more info.
Be careful to remove the statements from your code before deploying it, because your users won’t have Firebug installed, and JavaScript will then fail when it tries to output to the console object. Also, you certainly don’t want users to see your debug output.
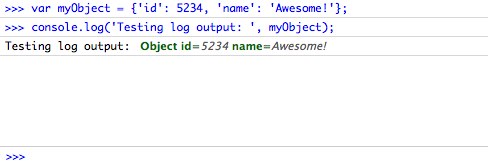
console.log in action
Breakpoints
Pausing scripts to investigate the system at a current point in time can be very valuable in solving bugs. To use the breakpoint feature click just to the left of a JavaScript line. This will set a breakpoint and make a red dot appear.
You can also add a conditional breakpoint by right clicking on a line number. Now the program will only pause under your specified condition.
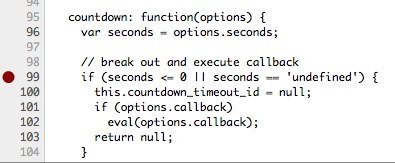
Setting a breakpoint
JavaScript Errors
Firebug will print out JavaScript errors with the corresponding file and line number. An absolute must for any JavaScript development.
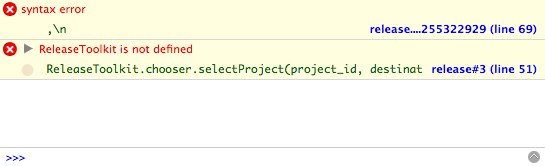
A JavaScript Error
Those are the key feature I use most often, but there are many more JavaScript features in Firebug, including stack traces, watching expressions, profiling and viewing events.